‘The only certainly in life is death and taxes’.
Yes we’ve all heard that one, but with the recent increase in National Insurance pushed through, have you ever actually had a look how the tax you pay over is spent?
The UK government spent around £13,200 per person in 2019-20, the table below shows us how they did it (source: Public expenditure data summary for 2019-20)
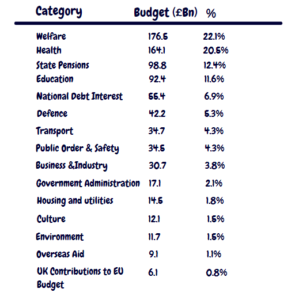
Yep. That’s some big numbers there. Around 55% of the total is ‘day-to-day’ spending on public services, with the NHS, schools and prisons making up a big chunk. Around 35% is on ‘welfare’ or social security – universal credit and the state pension.
What is ‘welfare’?
Topical at the moment, but broadly speaking it includes all spending on benefits and services provided by the government, so sickness and disability, child benefit, unemployment benefits, housing benefits, tax credits and and public sector benefits to name some.
How does the UK compare?
We’re spending roughly 38% of GDP (Gross Domestic Product). Across the EU the figure is 45%, the highest countries being Finland (54%), Belgium (52%) and Denmark (51%). Our friends in the US come in at 35%.
It’s going to be interesting revisiting this for 2020-21 with Brexit and Covid impacts.
Any questions on this or want to discuss it? Drop us an email at hello@pennybooks.io
James Watson